There is always one more data bug
If we, as data scientists, receive a dataset from a reliable source, we should go ahead with the analysis (classification, clustering, deep learning, etc), right?
Well, yes, that’s what most of us (myself included) often do, especially if there is a tight deadline. However, this could be dangerous. Let me describe some rude awakenings I suffered over the past decades, as well as remind you some fast and easy preventive measures.
Examples (a.k.a. horror stories)
E1 Geographical data
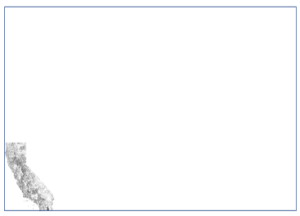
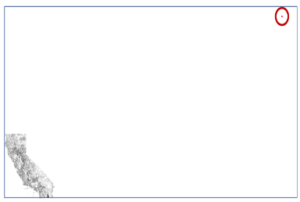
Two decades ago, we got access to a public dataset of cross-roads in California, that is, about 10,000 points in two dimensions ( (x,y) pairs). We plotted it to include it in the spatial-indexing paper we wanted to submit – the plot looked mostly empty, with a lot of points in the shape of California, at the bottom-left corner (see Figure [fig:ca](a)).
Why so much empty space?
The answer was that there was a single point somewhere in Baltimore (Atlantic coast), thousands of miles away from California. Clearly a typo – maybe the coordinates had the wrong sign or so. Since it was just one point, we deleted it.
 (a) Q: why is the CA dataset at the bottom left and the rest, empty?
 (b) A: because of a tiny stray point in Baltimore…
E2 Medical data – many ‘centenarians’
I heard this instance from a colleague at CMU (let’s call him ’Mike’). He was working with patient records (anonymized-patient-id, age, symptoms, etc). ’Mike’ was very careful, and did a histogram of the age distribution – and he noticed that ’99’ was an abnormally popular age! He asked the doctors that owned this dataset – they replied that, yeah, that’s what they used as a ’null’ value – since for some patients the age is unknown.
Remedies – Conclusion
Given that “There is always one more data bug”, what should we do as practitioners? While there is no perfect solution, I found useful the following defensive measures:
R1: Visual inspection – ’Plot something’: For any dataset, it often helps if we plot the histogram (’pdf’) of each numerical column. We could even try logarithmic scales, when we expect power-laws: Zipf, Pareto, etc. Spikes/outliers may spot anomalies (like the ’99’ age of the medical records incident).
R2: Keep in touch with the data owner: The medical doctors knew that ’99’ was the null value; in general, domain experts can help us focus on the real anomalies, as opposed to artifacts.
In conclusion, Data Science is fun and typically gives high value to the data owner. However, there is always room for errors in the data points, sometimes with painful impact. Anticipating and spotting such errors can help us provide even higher value to our customers. Paraphrasing our software engineering colleagues: There is always one more data bug.
Written by CMU
© AIDA, 2023
