AIDA Research on Suspicious Behavior and Anomaly Detection
One of the goals of the AIDA Project is to investigate and identify new ways to help Analysts find Anomalous Behavior (of any kind) in large and complex pools of data. We hope this can ultimately lead to significant improvements in the detection of fraudulent activity occurring on Telecom Networks, especially in the light of new technologies like 5G already expanding on the market. Moreover, we now see over more sophisticated, complex and robust methods being used for committing fraud on Telecomm Networks but also increasingly expanding to the world of Communication Service Providers and the Internet.
In essence our goal is to create and develop new tools that can provide new ways to help the Data Analyst and Data Scientist better understand and make sense of information originated from huge and dynamic pools of data such as that originating from Telecom Operator’s traffic activity. This type of data displays very particular characteristics as it is based upon human interactions prone to exhibiting strong and established patterns and Data Visualization functionalities when designing and building these new tools.
We believe this can ultimately lead to better results at detecting Anomalous Behavior and uncover suspicious activity that would otherwise have remained undetected, which in turn can potentially stand as the basis for developing the next generation of commercial products and solutions aimed at tackling Anomalous Behavior in Telecom Operators’ traffic activity and other related scenarios.
Case Building and Smart Fraud
One of the ideas behind this approach was to establish a strong focus on facilitating the opening and development of new cases by the end user (usually the Analyst). Case Building is a crucial part for the Analyst to manage his investigation work in order to allow the Analyst to follow a logical sequential analytical process, where there is the possibility to deep dive on data of interest as well as the opening and creation of new cases with ease. Current solutions such as those used at Mobileum include smart monitoring features that sense when there is an unusual activity exhibited by the Operator traffic data. When a suspicious event occurs, the application can set a temporary alert on that specific agent, attempting to keep fraud losses to an absolute minimum without interrupting legitimate activity. This approach functions more as a broad analysis that can detect alterations to the normal flow patterns of traffic data. Therefore, usually only the more obvious and evident anomalous activity can be detected through such methods, which leads to a lot of illegal activity passing under the radar of these solutions. The Analyst here usually does not have the ability to perform a sequential deep dive on the data and to reflect at multiple perspectives sequentially layered in a manner that can facilitate the workflow of the user.
This is made more difficult with the increase of Smart Fraud where fraudsters are increasingly developing more sophisticated, efficient and complex ways to commit Fraud be it for increasing success rates or to adapt to the adoption of anti-fraud mechanisms by the Telecom industry.
The advent of AI and the ever more sophistication, creativity and expertise of Fraudsters are major factors for this. New methods used by Fraudsters focus on attempting to mimic “normal” non-fraudulent behavior that can increase the chances of avoiding detection, through several ways. For example, regarding call traffic activity we have seen approximations on call duration, frequency and even ensuring that verified contacts are also included in the fraud committing process.
We believe the work carried out in the AIDA Project will significantly contribute to new solutions that increase the accuracy in detecting Anomalous Behavior. We provide a brief overview on some of the work conducted so far in the next section.
Graph and Node Analysis in Anomaly Detection
One of the goals of this work was to provide Analysts with new ways to analyze Telecom traffic activity that can lead to the detection of anomalous behavior that is not detected using classic methods. In that line we have introduced Graph Analysis to our research together with powerful statistical and feature exploration focused on providing powerful and insightful Data Visualization tools and techniques that can strongly help Analysts analyzing traffic data. One of the methods of choice to explore in such research is the study of Anomalous Behavior and suspicious activity using graphic objects such as time evolving graphs. Graphs are very powerful for analyzing human interactions and therefore make exceptional candidates for studying and analyzing anomalous behavior from Telecommunication Networks’ traffic activity. Here, individual agents (people) are represented by nodes of the graph and the links between them represent connection events established by those nodes. We are interested to understand the patterns that occur in this type of data, like who-calls-whom, who-sends-money-to-whom the focus was on the unsupervised cases, where there are no labels.
Our work so far with Anomalous Behavior has led us to use these approaches and techniques in the study of Fraud occurring in Telecom Networks. We have been developing new analytical solutions that we have been testing with a real-life dataset originating from an existing Telecom Operator. Together with the help of high expertise in this business domain, we were able to detect significant anomalous behavior in novel and potent ways which positively reinforces the potential and value of this application. More specifically we were able to identify new cases with high potential for Bypass Fraud. Furthermore, we present a case that was later confirmed by the Telecom Operator as a newly confirmed Bypass Fraud case that had not been previously identified. A recent solution we have recently published is depicted in figure 1.

The proposed solution follows three sequential steps:
- Step 1: ‘Feature-selection’: by carefully choosing features to extract from each node;
- Step 2: ‘Summary’: high-level, interactive summary of the data;
- Step 3: ‘Deep-dive’: allowing the user to focus on suspicious nodes.
The initial idea was to start with several informative features that can help Analysts get a better understanding of the data they are looking at (as shown below in fig. 2 (a)). Upon selection of desired features to visualize, we can dive into the structure of the data and try to identify and find patterns or nodes that seem anomalous or somehow suspicious.
The Summary comprehends a high-level yet detailed interactive view of the data (as show in fig 2 (a)). It is possible to visualize data in a variety of ways that can highlight different aspects, patterns and behaviors that can be further investigated.
The deep-dive consists on a drill down on suspicious or interesting nodes that ask for further investigation (as shown in fig. 2 (b) and (c)). Here we can explore several important metrics exhibited by the selected group of nodes. This can help to detect patterns and relationships between different nodes and infer about anomalous behavior. Additionally, we explore the use of EgoNets, a very powerful way to look at relationships in the data. The idea is to be able to drill down on any nodes and relationships of interest and understand specific metrics and statistics associated with them.
This approach was designed to work with labeled and unlabeled data. It is of special significance the possibility for addressing Anomalous Behavior investigation on unlabeled data, as this will inevitably always constitute the vast majority of newly generated data.
One of main ideas in the design of this solution was to allow the user to interact with the data in a way where it could be possible to select specific areas of interest in the graph for further investigation. This can then allow the analysis of suspicious groups of nodes in the graph that may share similar attributes, patterns or behavior. A major advantage for this is to be able to switch from a case-by-case approach, where the Analyst has to look at each single potential case individually and is thus less informative and more time-consuming, to one of group behavior analysis. By analyzing whole groups of nodes, we can broaden our scope of analysis and gain a better idea on the overall potential fraud events occurring in the data. Additionally, when detecting a suspicious case it becomes easier to infer about related events exhibiting the same kind of behavior. Generally, the visualization of the graph nodes and respective interactions allows us to evaluate the behavior of a particular group and identify the fraudulent nodes e corresponding victims.
Also, the use of parallel graphs provides a powerful means to visualize and analyze different metrics (more than twenty at the moment) that can assist in the investigation process.
Success Case Study
In this publication we present a success case that showcases how new events of fraud that had been previously undetected by traditional methods can be detected. We went from an initial dataset comprising of a pool of events (calls) of traffic activity from a Telecom Operator and were able, through Data Visualization techniques, to successfully identify a new fraud case. This was an instance of International Bypass fraud, one of the most prevalent and damaging types of fraud.
The data set used for the analysis presented here was not labeled and is comprised of a pool of 2 days of traffic activity (events are phone calls) from a large Telecom Operator.
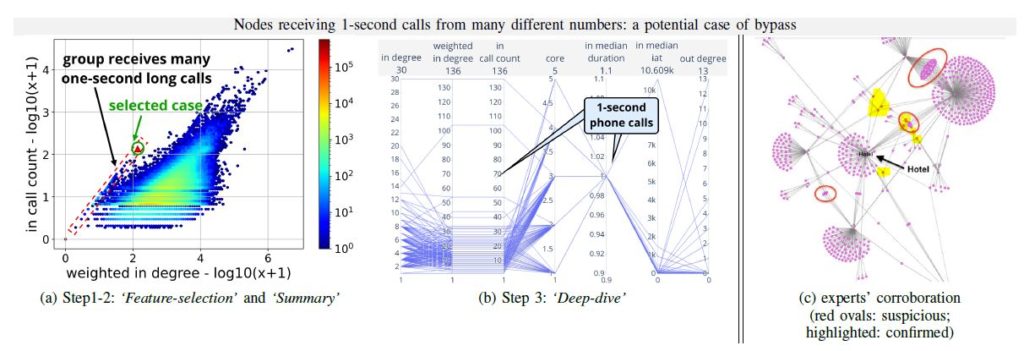
Figure 2 depicts the analytical process undertaken in the analysis that led to the identification of the success case presented here.
In figure 2 (a) we can see a plot representing the relationship between number of calls and calls received. Here we detected a group of suspicious nodes (red dashed rectangle) that displayed a pattern diverging from normal behaviour as seen by the representation of the full dataset.
From there we looked at the various features computed by the application to get a better grasp at the behavior displayed in that case. We noticed a pattern of 1-second phone calls that was not a standard behavior.
We further deepened our investigation by computing an graphical visualization of the EgoNet of the data of interest and we could learn that many of these 1-second long phone calls were strangely being made to an hotel. We suspect this was indeed Anomalous Behavior and likely indicative of fraudulent activity related with the International Bypass.
Conclusion
One of the many outcomes of the AIDA Project has been the research and development of new algorithms and data visualization solutions that can add to the catalogue of tools addressing the detection and identification of Anomalous Behavior. Here we have discussed a solution, developed by AIDA partners Carnegie Mellon University and Mobileum, designed for the study and detection of Anomalous Behavior in large pools of data. We have addressed new ways for the study of Anomalous Behavior by Analysts tackling Fraud using the power of time evolving graphs. The proposed solution is designed in a sequential manner that allows the user to dive in specific areas of interest in the data. Also, the user can deepen the analysis by investigating multiple ways the data is interconnected.
This provides the ability to detect fraud patterns occurring on the data by groups of nodes which contrasts with the narrower scope of single case analysis that is used in current state-of-the-art commercial solutions.
We have built a tool focusing on group analysis and attention routing that allows the identification and visualization of fraud patterns in a network.
By using this approach with an initial set of unlabeled data we were able to detect Anomalous Behavior that was confirmed to constitute Fraud activity in a quick and efficient manner.
We reinforce the strong emphasis on a solution that can provide powerful Data Visualization features that allows the user to successfully tackle Anomalous Behavior and fraud activity. The possibility for deep dive in data points (nodes) of interest and collect valuable information from the relationship between these data points is of special significance. Here, the possibility to perform drill down through a Lasso Selection of the data of interest should reveal to be highly valuable in this type of analytical work.
This application also provides the possibility for addressing and detecting new cases of Smart Fraud that aims to mask itself within “normal” behavior by adopting new and ever more unsuspected mechanisms and techniques.
Next Steps
This is ongoing work as we continue to explore these research vectors. One of the main areas of interest we want to focus our work on is Attention Routing. This will help to improve the study of areas of interest in the data that are blurred across the normal distribution behavior and are often ignored.
We are exploring new ways to analyze of groups or clusters of data and continue with our research in parallel graphs and the use of spring models for visualization and interaction.
Finally, we are thinking on how to evolve to solutions that can be made more pro-active, possibly suggesting suspicious cases based on an automated informed analysis. We hope this could ultimately have a great impact on the industry of Fraud Management.
References
TgrApp: Anomaly Detection and Visualization of Large-Scale Call Graphs (2022 International Conference on Big Data (IEEE BigData 2022), AAAI Proceedings (2022)).
CallMine: Fraud detection and visualization of million-scale call graphs (22nd IEEE International Conference on Data Mining on Data Mining (IEEE ICDM 2022)).
By Mobileum
© AIDA, 2023