Problem definition
Given a large, who-calls-whom graph, how can we nd anomalies and fraud? How can we explain the results of our algorithms? This is exactly the focus of this project. We distinguish two settings: static graphs (no timestamps), and time-evolving graphs (with timestamps for each phone). We further subdivide into two sub-cases each: supervised, and unsupervised. In the supervised case, we have the labels for some of the nodes (‘fraud’/’honest’), while in the unsupervised one, we have no labels at all.
Major lessons
For the supervised case, the natural assumption is that the labels are absolutely correct and thus we only need to build a classier, using our labelled set as the ‘gold set’. However, this is a pitfall: the ‘fraud’ labels are almost always correct (notice the ‘almost’), while the ‘honest’ labels are often wrong. Thus, we need to develop algorithms that can tolerate (and ag) those of the labels that seem erroneous. There is work on this line, under the area of ‘weak labels’, with some excellent work on the so-called ‘con dent learning’ [8]. The second insight is that there are many types of fraud, as well as many types of ‘honest’ behaviour. We already mentioned that in the context of Twitter followers [10]. For phonecall networks, there are also many types of fraud: telemarketers, phishing attempts, redirections to expensive 900 numbers, to name a few.
Our tools – unsupervised case
The most creative and most interesting part of the project is the feature extraction: what (numerical) features should we extract from each node, to try to nd strange nodes? The obvious ones are the in- and out-degree of each node; the total number of minutes in calls and out-calls. More elaborate ones include centrality measures, like Google’s super successful PageRank [2] the number of triangles in the agent of the node [1] Thus, every node becomes a point in n-dimensional space, and thus we can employee all the unsupervised algorithms, like clustering (DBSCAN [9], OPTICS), outlier detection (isolation forests [7]), micro-cluster detection [6].
Our tools – supervised case
Here we have two families of tools: the first is to build a classier for the n-dimensional
space that we can create with the feature extraction above. There is a wealth of classifiers to choose from – ‘autoGluon’ [3] automatically tries several of them and picks the best.
The second is to exploit network acts, with tools like label propagation, belief propagation, semi-supervised learning (eg., FaBP [5]; zooBP [4]).
Preliminary results
Figure 1 gives some results for the supervised case. The scatterplots (actually, heatmaps, to highlight the over-plotting) have one dot for each customer, with the axis being the (weighted) in-degree versus the (weighted) out-degree. Both axis logarithmic (log(x + 1), so that we keep the zeros).
Notice that most points (fraud/honest) are along the diagonal, indicating that reciprocity is to be expected.
Also notice that there are some extreme deviations from reciprocity, namely, points along the axis. This means that there are customers that call, but never get called back (like, eg., telemarketers) and the other way around (like, eg., help-lines).
What distinguishes the fraudsters from the honest customers, is the magnitude of activity. Notice that most of the fraud customers tend to be around the 104; 104 points, while most honest customers are close to the 103; 103 point.
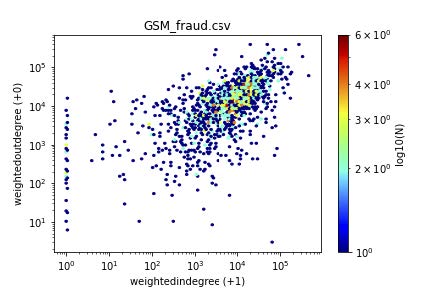
(a) Fraud
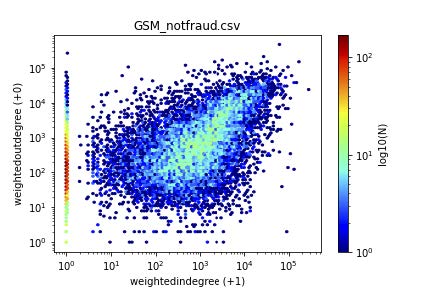
(b) Honest
Figure 1: Visualization helps: heatmaps of in-versus out-degree (weighted): Fraud (left) vs honest subscribers (right)
Conclusion
Looking for patterns and anomalies in large, real graphs never gets boring: there are always new patterns to look for, new activities by the fraudsters (as well as new activities by the honest ones). Despite the fact that there are already some excellent tools for graph analysis, there is always room for more.
References
[1] Akoglu, L., McGlohon, M., and Faloutsos, C. oddball: Spotting anomalies in weighted graphs. In PAKDD (2) (2010), vol. 6119 of Lecture Notes in Computer Science, Springer, pp. 410{421.
[2] Brin, S., and Page, L. The anatomy of a large-scale hypertextual web search engine. Comput. Networks 30, 1-7 (1998), 107{117.
[3] Erickson, N., Mueller, J., Shirkov, A., Zhang, H., Larroy, P., Li, M., and Smola, A. J. Autogluon-tabular: Robust and accurate automl for structured data. CoRR abs/2003.06505 (2020).
[4] Eswaran, D., Gunnemann, S., Faloutsos, C., Makhija, D., and Kumar, M. Zoobp: Belief propagation for heterogeneous networks. Proc. VLDB Endow. 10, 5 (2017), 625{636.
[5] Koutra, D., Ke, T., Kang, U., Chau, D. H., Pao, H. K., and Faloutsos, C. Unifying guilt-by-association approaches: Theorems and fast algorithms. In ECML/PKDD (2) (2011), vol. 6912 of Lecture Notes in Computer Science, Springer, pp. 245{260.
[6] Lee, M., Shekhar, S., Faloutsos, C., Hutson, T. N., and Iasemidis, L. D. Gen2out: Detecting and ranking generalized anomalies. In IEEE BigData (2021), IEEE, pp. 801{811.
[7] Liu, F. T., Ting, K. M., and Zhou, Z. Isolation forest. In ICDM (2008), IEEE Computer Society, pp. 413{422.
[8] Northcutt, C. G., Jiang, L., and Chuang, I. L. Con dent learning: Estimating uncertainty in dataset labels. J. Artif. Intell. Res. 70 (2021), 1373{1411.
[9] Schubert, E., Sander, J., Ester, M., Kriegel, H., and Xu, X. DBSCAN revisited, revisited: Why and how you should (still) use DBSCAN. ACM Trans. Database Syst. 42, 3 (2017), 19:1{19:21.
[10] Shah, N., Lamba, H., Beutel, A., and Faloutsos, C. The many faces of link fraud. In ICDM (2017), IEEE Computer Society, pp. 1069{1074.
By Carnegie Mellon University