Acknowledgements
The results and analysis presented here were done with contributions from Mirela Cazzolato (USP, and CMU), Saranya Vijayakumar (CMU), Xinyi (Carol) Zheng (CMU), Meng-Chieh (Jeremy) Lee (CMU), Namyong Park (CMU), Pedro Fidalgo (Mobileum), Bruno Lages (Mobileum), and Agma Traina (USP).
Reminders – Problem definition and past insights
As we mentioned in the February 2022 blog post, the problem we are focusing on is to spot fraudulent behavior in a who-calls-whom-and-when graph. We distinguished between the supervised case (where we are given a list of fraudulent subscribers (labeled data)), and the un-supervised one, where we are not given any such labeled data.
The two main insights where (a) the labeled data could be wrong: a subscriber labeled as ’honest’ may turn out to be fraudulent after closer inspection and (b) there are many types of fraud, including telemarketers/scammers (’you owe taxes’); subscribers bypassing the legal ways of making international calls; subscribers using fake or stolen credit cards; and many more.
New Insights
For the supervised case, we can build classifiers (random forests, autoGluon), which will be as good as the quality of our labels, and which will never be able to spot new types of fraud.
For the un-supervised case that we focus here, the main insights are
Fraudsters often exhibit lock-step behavior: for example, too many callers call the same (large number) of destinations, about the same time.
Visualization is a powerful way to explain to a non-analyst why our algorithm suspects a given set of subscribers.
We elaborate with an example, next.
Deep dive
Figure 1 illustrates the main ideas and insights.
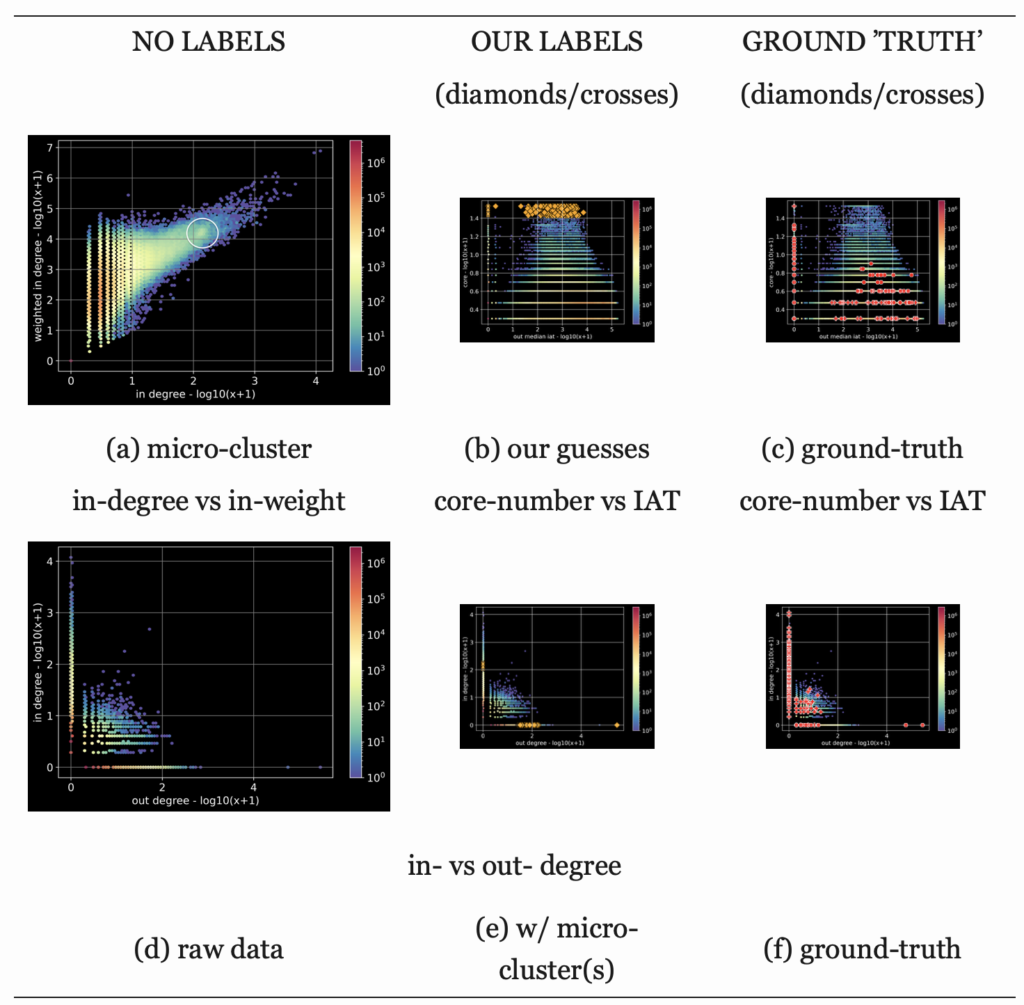
Raw data: Figure 1 (a) and (d)
The first column shows two of the many scatter-plots we are proposing: The first row ’(a)’ plots the in-degree (total # of friends calling in) versus weighted in-degree, in log-log scales since we have power-laws as we expected. Like all other scatter plots, this is a heatmap – notice that even the scales of the heatmap are logarithmic: The vast majority of subscribers, in red/orange colors, receive a few phonecalls ( ≈ 101), and the total talking time is relatively short ( ≈ 102). Not surprisingly, there is a correlation: the more people call you, the larger the total duration of the phone calls. What is surprising is the micro-cluster inside the white circle, at (102, 104): Many people ( ≈ 103 – light-yellow colormap) have surprisingly similar in-degree of about 100, and similar total duration of about 10,000 seconds.
Let’s dissect (d), the scatter-plot below it. Every dot is a subscriber; the axis are the in- and out-degree of each subscriber, again in logarithmic scales (log (x+1), to be exact). There is heavy overplotting (red/orange/yellow colors) for small values – that is, most subscribers receive and initiate only a few phonecalls. There are two un-expected issues: The first is that there is little reciprocity: analysis of earlier who-calls-whom networks [1] reported that usually people who make xphonecalls, also receive about x phonecalls. Thus, we would expect to see a strong diagonal along the 45 degree line – but it is not there.
The second observation is that there are a lot of people who never return a phonecall (all the dots on the horizontal axis – our domain experts call them ’black holes’), and similarly many people that receive no incoming phonecalls (’volcanoes’). These behaviors are not necessarily bad: for example, an emergency room or a help desk would behave like a ’black hole’. However, several fraudulent behaviors are so asymmetric, like, eg., scammers (’you owe taxes’).
Our Guesses (b), (e)
The second column of Figure 1 shows our guesses for fraudsters (orange diamonds and crosses, for ’volcanoes’ and ’black-holes’ respectively). The crucial plot is (b), which shows the ’core-number’ versus inter-arrival time (IAT). The core-number has a complicated definition, 1 but the intuition is that nodes with high core number belong to a densely connected community.
In Figure 1(b) notice that, while the vast majority of nodes (red/yellow dots at the bottom-middle of the graph) have low core-number (2-5), there are several with very high core number (≈20). Plotting them on the in- vs out-degree plot (’(e)’), about half of them are ’volcanoes’ (diamonds on the horizontal axis) and the rest are ’black-holes’ (crosses, on the vertical one). We shall refer to them as leadsfrom now on.
It turns out that most of our leads actually call each other, forming a very dense bi-partite core; such subgraphs are typically fraudulent in social networks (like Twitter [3] , FaceBook [2] )
Our domain experts confirmed that our leads are indeed fraudulent.
Comparison with the ’ground truth’
Our dataset already had labels, and we show them in the last column of Figure 1(c) and (f). Notice that (c) and (f) are exactly parallel to the middel column ((b) and (e)), with the only difference that the ’ground truth’ column has the labeled nodes in red. As in the ’leads’ case, diamonds and crosses correspond to ’volcanoes’ and ’black-holes’ respectively.
The main observation is the following:
The investigators who labeled the data, completely missed our ’leads’, with the high core-number
This is exactly the reason that we call the labeled set as ’ground truth’ within quotes: Several of the fraudsters may be flying below the radar, as we showed with our ’leads’ of Figure 1(b) and (e).
Conclusions
We repeat our two insights:
Fraudsters often exhibit lock-step behavior, resulting in micro-clusters and dense communities or bi-partite cores
Visualization helps explain our ’leads’ (as we did with the micro-clusters in Figure 1(a),(b)
Citations
- [1] Akoglu, L., de Melo, P. O. S. V., and Faloutsos, C. Quantifying reciprocity in large weighted communication networks. In PAKDD (2) (2012), vol. 7302 of Lecture Notes in Computer Science, Springer, pp. 85–96.
- [2] Beutel, A., Xu, W., Guruswami, V., Palow, C., and Faloutsos, C. Copy-catch: stopping group attacks by spotting lockstep behavior in social networks. In WWW (2013), International World Wide Web Conferences Steering Committee / ACM, pp. 119–130.
- [3] Hooi, B., Song, H. A., Beutel, A., Shah, N., Shin, K., and Faloutsos, C. FRAUDAR: bounding graph fraud in the face of camouflage. In KDD (2016), ACM, pp. 895–904.
Formally, the k-core of a graph is a maximal subgraph that contains nodes of degree k or more; the core-number of a node is the largest value of k of a k-core that contains that node.
By Carnegie Mellon University